Flow
Client mode / Flow
With its WAN path module, LiveSP offers a simple and innovative visualization of end-to-end flows. Designed for VPNs set across just a few or thousands of sites, it combines traffic metrics and distribution aggregated visualization, with performance metrics timeline visualization. By selecting source site, LiveSP discovers destination sites and displays DSCP and networks used to transport the data. You are now able to understand the core functionalities of Cisco Performance Routing features.
Display end-to-end flows by clicking
 in the client main menu.
in the client main menu.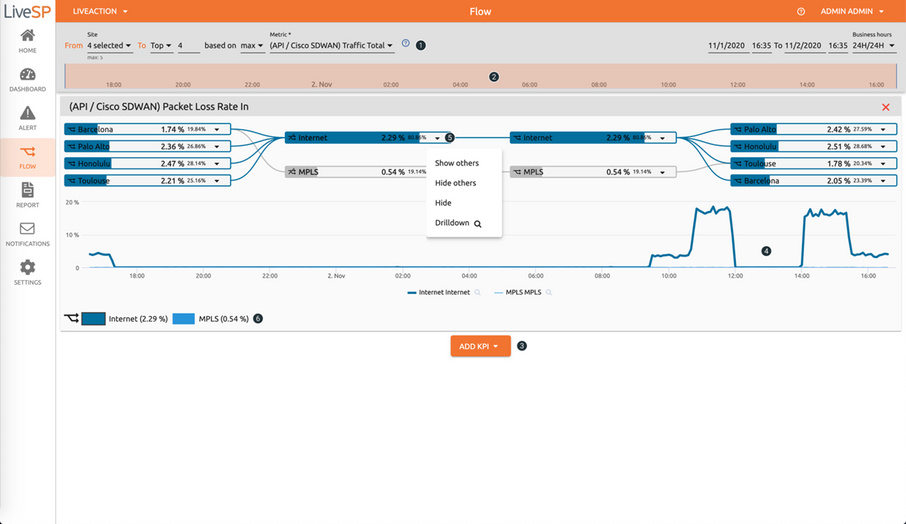
1. Select source and destination sites.
2. Select processing period.
3. Add (and remove) performance KPIs.
4. Visualize aggregated traffic per network on the selected period.
5. Use the arrow to show or hide paths and drill down to dashboards.